Unemployment Rate of Large Metropolitan Areas
Annual Average (%) 2016—2022
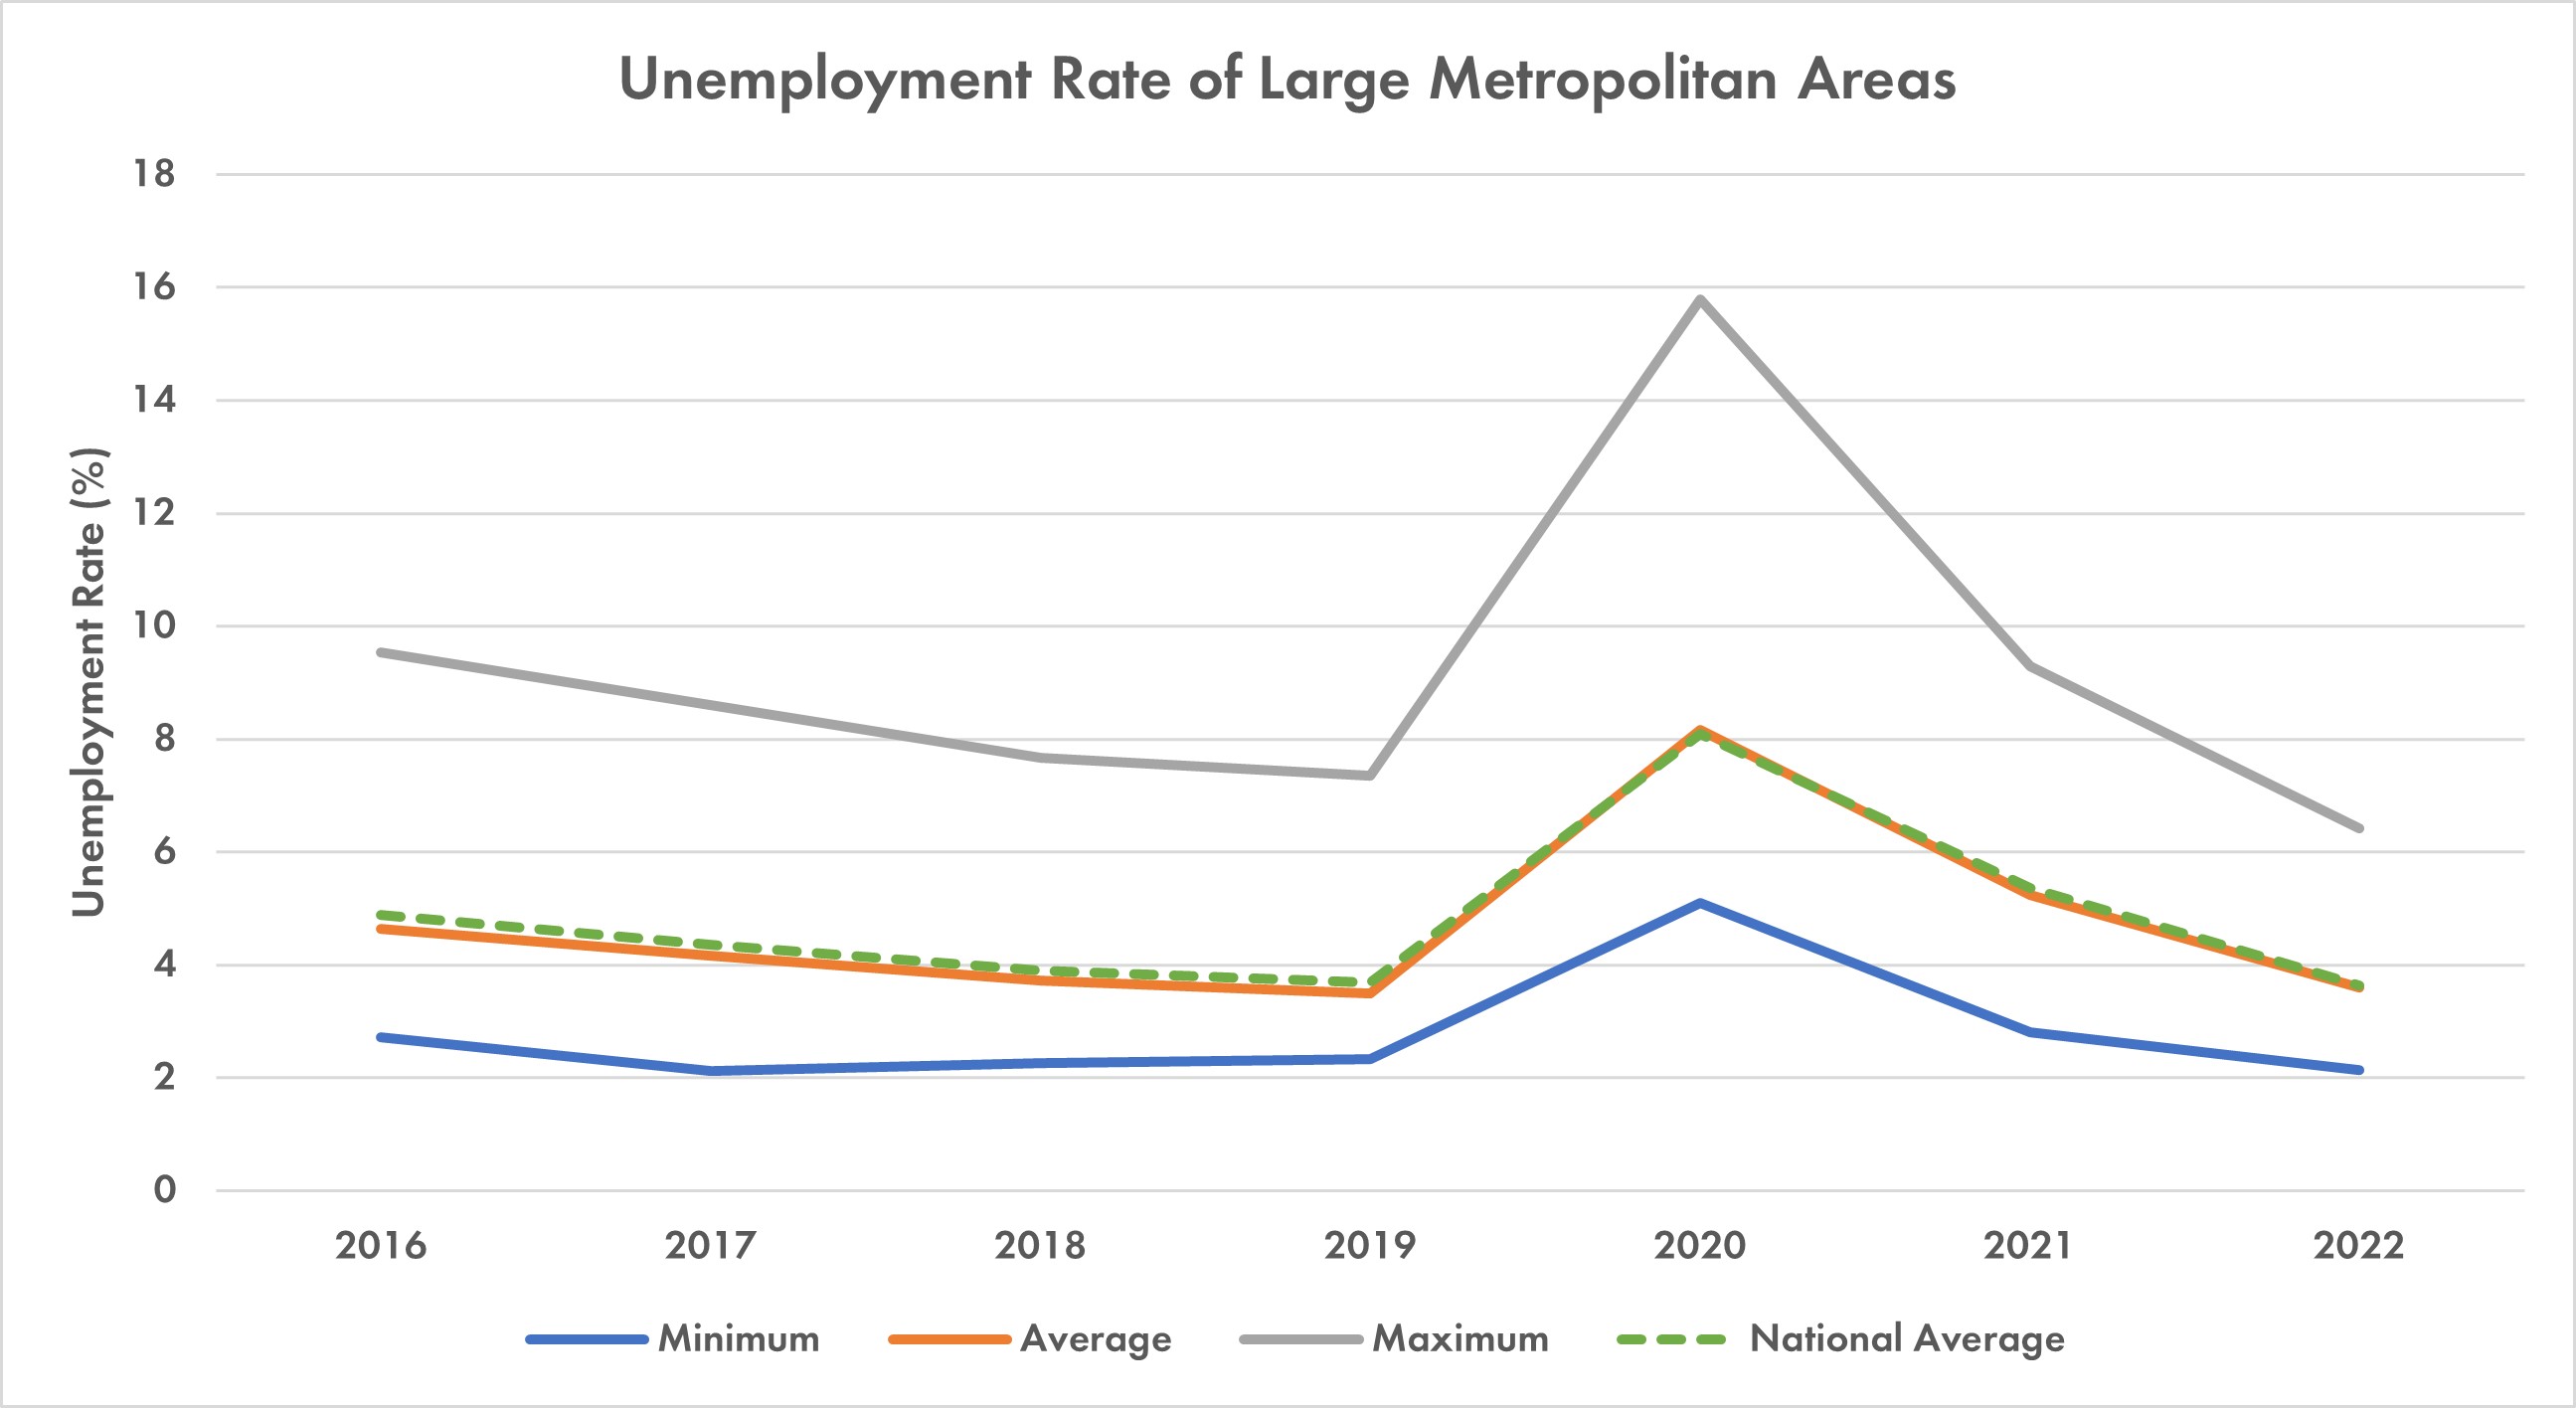
This interactive map shows the average annual unemployment rate for metropolitan areas larger than 1 million people. I retrieved the data from the U.S. Bureau of Labor Statistics. From 2016 to 2019, the overall unemployment rate was decreasing as the economy remained strong. But in 2020, COVID-19 forced the nation into lockdown. Unemployment rates soared across the country. The Las Vegas metro area had the highest rate among large cities, at 15.8%. Its casino resorts shut down as people stopped traveling for pleasure.
The base map is from Mapbox, and the controls were created with Leaflet.
As lockdown eased in 2021, the unemployment rate began to fall, reaching pre-COVID levels by 2022. Salt Lake City had the lowest unemployment rate in 2022, at 2.1%.